


Until recently, there was no satisfactory scientific answer to this question, but Lyxor’s research teams have changed all that.
Traditional selection tools are not suited to ETFs
Institutional investors, such as pension funds, insurance
companies and balanced fund managers who rely heavily
on trackers, have to bear this in mind when choosing the
best ETFs for their portfolio.
They face a major challenge. The analysis tools traditionally
employed for active fund selection are not suited to selecting
ETFs. In its simplest expression, active fund selection
is based on one fundamental criterion: the information
ratio. This indicator measures a fund’s return relative to its
benchmark index, taking into account the relative risk taken
compared with said index. However, using the information
ratio to compare ETFs has a limitation which totally invalidates
the analysis.
As a reminder, the information ratio is the ratio of
outperformance (alpha) to tracking error (TE) volatility. In the
case of ETFs, which replicate the index, the outperformance
and TE figures are very low and the information ratios are
therefore extremely sensitive, making traditional analysis
irrelevant. Moreover, a product with a very low tracking error
could easily be mistakenly ruled out on account of a weak
information ratio, despite excellent index replication. Lastly,
a product underperforming very slightly and with a very low
TE will be ruled out on account of its negative information
ratio, whereas a product with marginal outperformance will
be retained even with a high TE.
A new framework for measuring ETF efficiency…
Basically, from an investor’s point of view, a good ETF
should maximise the chances of replicating index returns.
The fund must also display a low bid-ask spread in order to
preserve the profit on the trade. In fact, a suitable analysis
framework for ETF selection derives from three fundamental
parameters: an estimate of the performance gap between
the fund and its benchmark (i.e. the tracking difference);
the volatility of this performance gap (i.e. the tracking error);
and the difference between the buy and sell prices (i.e. the
bid-ask spread or “liquidity spread”). By applying Value at
Risk (VaR) – now the most widely used measurement of
risk – to these three parameters, it is possible to accurately
measure the efficiency of an ETF.
In concrete terms, by using a one-year Gaussian VaR at
a 95% confidence level, this efficiency measurement is
expressed as follows:
Efficiency = Tracking Difference – Liquidity Spread – 1.65 x Tracking Error
For instance, if the efficiency of the ETF is equal to -50 bps, the
probability that the investor faces a relative loss with
respect to the index larger than 50 bps is exactly equal to 5%.
Using this risk measurement therefore makes it easy to
compare the efficiency of two ETFs. This model, which is
described in detail in a research article available online at
http://ssrn.com/abstract=2212596, and which was
also published in Journal of Index Investing, works
as follows. The higher the outperformance of an ETF, the better
its efficiency, while a wider bid-ask spread makes it less
efficient. Equally, higher tracking-error volatility increases
uncertainty and thus makes the ETF less efficient. It is
interesting to note that comparing ETFs by efficiency rather
than by individual criteria available to investors (such as
outperformance, daily spreads or volatility) produces
different results. Therein lies the strength of this synthetic
indicator.
ILLUSTRATION 1 – MSCI Emerging Markets Index Efficiency Indicator

…taking account of institutional concerns
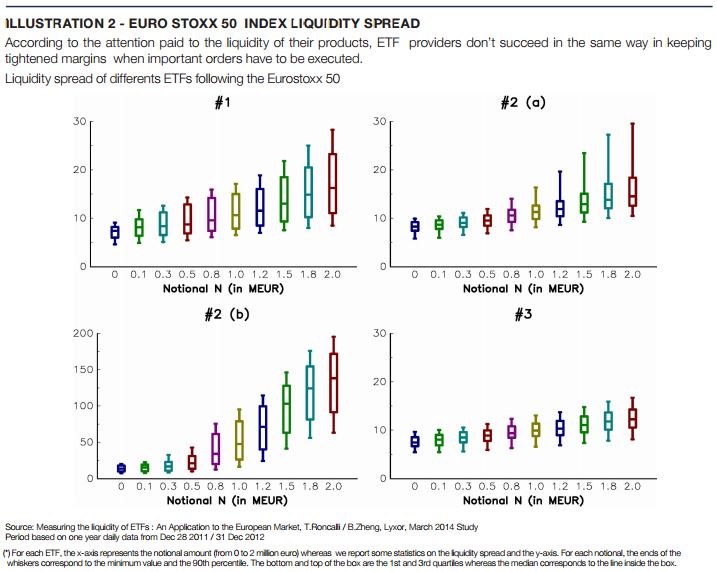
In the basic calculation for the efficiency indicator, we are
using the best limit order spread for the liquidity spread.
Yet, efficiency measurements can be refined in order to
better reflect the daily realities of institutional investors. Such
investors’ orders can involve amounts running into tens of
millions of euro. Even when split, they generally cannot be
executed at the best limit. Based on order-book historical
data, it nevertheless remains possible to measure the
average bid-ask spread at which a given notional amount will
be executed. This “liquidity spread” can then be reintroduced
into the calculation of the indicator. Interestingly, depending
on whether the analysis uses a notional amount of 100,000,
1 million or 2 million euro, the efficiency measurement
pinpoints different ETF providers for the same index. This
highlights the importance of ETF liquidity for investors.
ETF providers eager to bring the highest level of service to
their investors must endeavour to improve the liquidity of their
products in order to minimise the bid-ask spread. Having a
large number of market makers is important for ETF liquidity.
At Lyxor, everything is done to ensure that each fund is
followed on average by nine market makers. In addition, in
order to allow each investor to use the model presented
in this article and select ETFs efficiently, it is essential that
ETF providers publish material on the tracking-error volatility
of their funds, in line with recommendations provided by
the European Securities Market Association (ESMA), and
that stockbrokers develop suitable statistical measures for
understanding ETF liquidity spread.
ILLUSTRATION 2 – Euro STOXX 50 Index Liquidity Spread



Add Comment