


The last twelve months have shown a dispersion in the returns
of CTAs. At the end of Q1 2016, the rolling one-year performance
of the SG Trend Index, which measures the performance of the
trend following industry, was -4.1%, whereas the performance
of the Lyxor Epsilon Global Trend fund was -1.7% for the same
period. Over 2015 as a whole the Lyxor Epsilon Global Trend
fund returned +5.4% and during Q1 2016 it returned +3.0%.
“The CTAs who did well during this period where those which
reduced overall exposures and focused on the few trends
available”, explains Guillaume Jamet, principal fund manager
of the Lyxor Epsilon systematic trend program.
Trend following strategies are also
referred to as Commodity Trading
Advisors, or CTAs. They exploit the
momentum effect: prices going up
(going down) tend to keep going
up (going down). Trend following
strategies work best in environments
in which markets show clear and
identifiable trends and in which
correlations between asset class
returns are low.
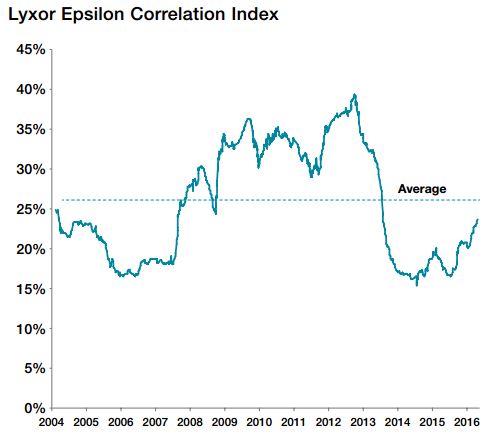
The less advantageous market context relates both to
correlations and on the level of market ‘trendiness’: The Lyxor
Epsilon Correlation Index increased from 20% to 24% during
the first quarter of 2016, approaching 26%, which is the
average index value since it was created in 2004.

The index is backward looking: it analyzes some of the drivers of the past performance of trend following strategies, but gives no indication
of future results.
Source: Lyxor AM. Data as of 31/3/2016
The Lyxor Epsilon Correlation
Index* uses various return and risk
indicators to estimate the correlation
amongst markets on a rolling 1-year
basis. A low value means that markets
tend to move independently, while a
high value means that markets tend
to move in lockstep.
“This environment clearly was less favorable than the twelve months ending Q4 2015, without becoming worrisome”,
comments Guillaume Jamet.
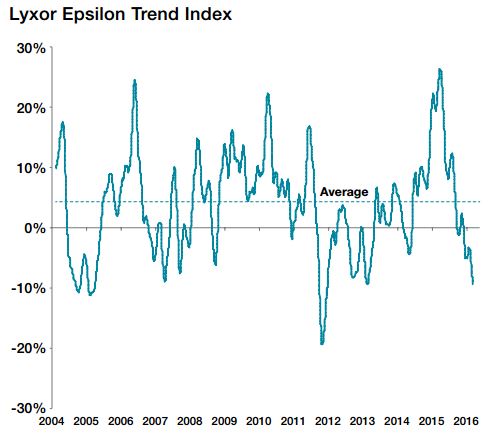
During the same period the Lyxor Epsilon Trend Index dropped from -2% to -10%. This value is well below 4%, which
is the average index value since it was created in 2004.
“Markets have been clearly rangy during the lasts 12 months
due to a high level of macro-economic uncertainty. 2016 seemed to start with trends, such as on equities and on oil,
but most of these trends reverted as of late February”, tells Mr. Jamet. “Models that adapted to this environment will
be reactive once trends re-occur. The overall exposure level of the Lyxor Epsilon Global Trend fund is below average
currently.”
The Lyxor Epsilon Trend Index* uses
various return and risk variables to
calculate the average strength of trends
on financial markets on a 1-year rolling
basis. A high measure means that, on
average, the financial markets included in
the index have been characterized by a
higher directionality, either downward or
upward. A value close to zero corresponds
to a regime when most markets are trading
randomly. A low negative index value means
that markets are “rangy” on average.

The index is backward looking: it analyzes some of the drivers of the past performance of trend following strategies, but gives no indication
of future results.
Source: Lyxor AM. Data as of 31/3/2016
Due to their diversification over a broad investment universe and their ability to go short, trend following strategies
are amongst the few strategies able to benefit from any macro trend, be it bear equity markets, interest rate hikes or
currency wars.

Add Comment