


This post is also available in:  Français
Global equity markets are near all-time highs, bond markets are
relatively calm, and currency volatility is reasonably low. This
benign state is being fuelled, at least in part, by optimism about
the US economy coupled with reduced fears of an ongoing swing
towards populism in Europe.
The rejection of Geert Wilders’ PVV party in the Dutch election
has temporarily halted the drift to the political Right we had
witnessed with the UK’s decision to leave the EU and the election
of President Donald Trump – and France/Germany credit spreads
tightened in response. But we are mindful that France goes to the
polls in April and the electorate could yet back Marine Le Pen and
her anti-EU platform, although analysis indicates that she would
need to secure around 10 million votes to swing a victory between
the first and second round of elections. Even so, a further march
to populism and an eventual ‘Frexit’ would place a lot of pressure
on risk assets, not least the European financial system and in
particular the banking sector, which is lacking capital in many
areas.
But it is the US that has been dominating our thoughts in recent
weeks. We had been neutral on US equities for eight months
going into the US election and the ensuing rally. Much of that rally
was based on policy proposals that the market considers positive,
in particular President Trump’s plans for corporate tax cuts.
Analysts estimate that for every 5% reduction in the corporate tax
rate, S&P500 earnings would rise by 4.2%. This translates to a
17% boost to earnings and dividends from Trump’s tax plans this
year (and every year thereafter). By early-March, the market was
already up by 15.5%, despite none of Trump’s policies coming
through – it is now more likely that any ‘good Trump’ policies will
be pushed back to 2018, or may never happen at all.
Re-rating has driven the lion’s share of returns in recent years, and we are not confident that
this can continue, particularly as the Fed ‘removes the punchbowl’ by further raising interest
rates. There are also risks to equity markets from tighter monetary policy and a lack of expected
fiscal stimulus, the combination of which would likely have negative consequences. On the
fiscal front, the legislative process to pass the new US administration’s proposals appears to be
longer than hoped, with meaningful gaps between perceptions in the House and Senate
(notably on Border Adjustment Tax) and reports of dissonance within ‘Team Trump’.
Finally, corporate profits are likely to be eroded by higher labour bargaining power as US wages rise, while return on expenditure may also be negatively impacted depending on if and how interest rate deductibility is implemented. Moreover, the rich valuation of US stocks must be looked at in the context of meaningful returns from elsewhere, such as Europe and Japan – those other areas are competing for money.
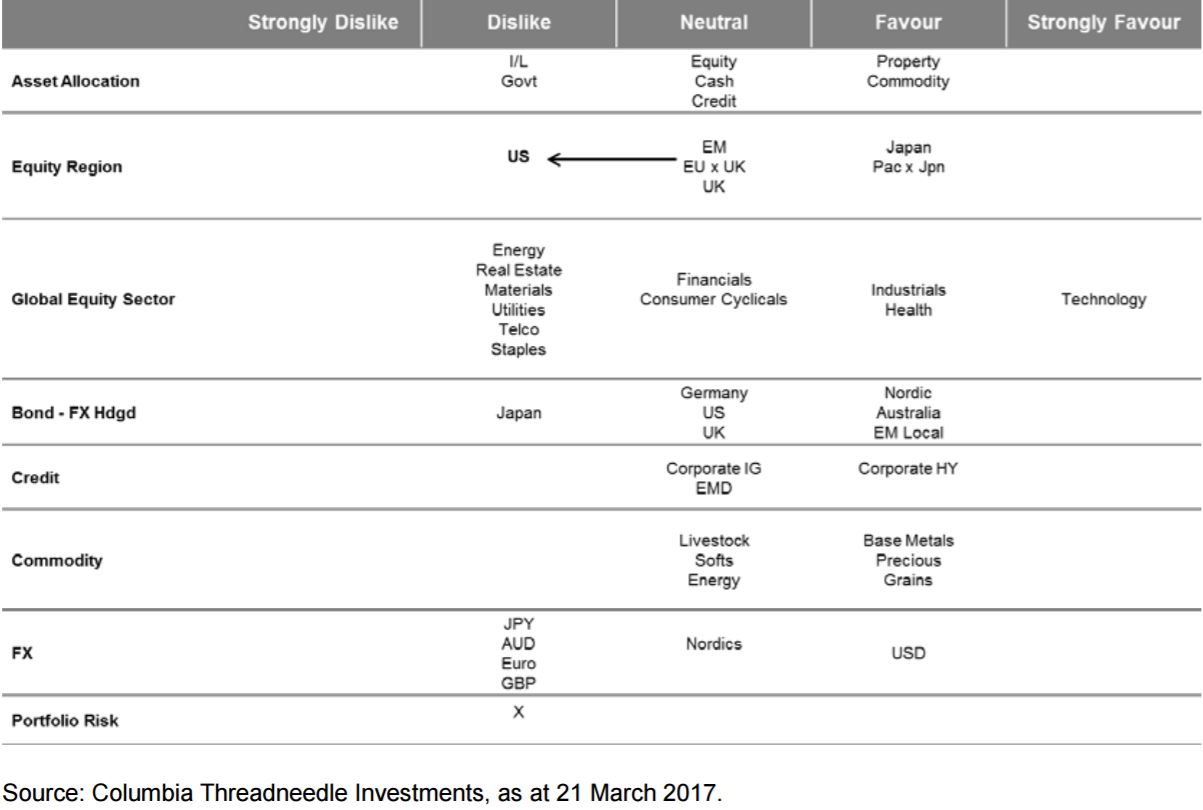
Taking all these factors into account, in early-March we decided to downgrade US equities from
neutral back to negative, though we remain neutral on equities overall (and currently favour
Japan and Asia ex-Japan).
A US equity market correction is, on balance, likely to be positively
correlated with fixed income, especially US government bonds. It is worth noting, however, that
while the Fed has brought forward the timing of its rate hikes with the recent rise, it is not
expected to increase the magnitude of further rises.
The market had clearly shrugged off any detrimental impacts of
the President’s policy proposals and we believe the S&P has run
ahead of solid fundamentals and economic data, and as a result
strength has been overstated. We also believe US equities are
fully valued, with the S&P priced at 22 times trailing earnings –
this is at the upper end of historical premia to the MSCI ACWI.
Figure 1: Asset allocation grid


Add Comment