


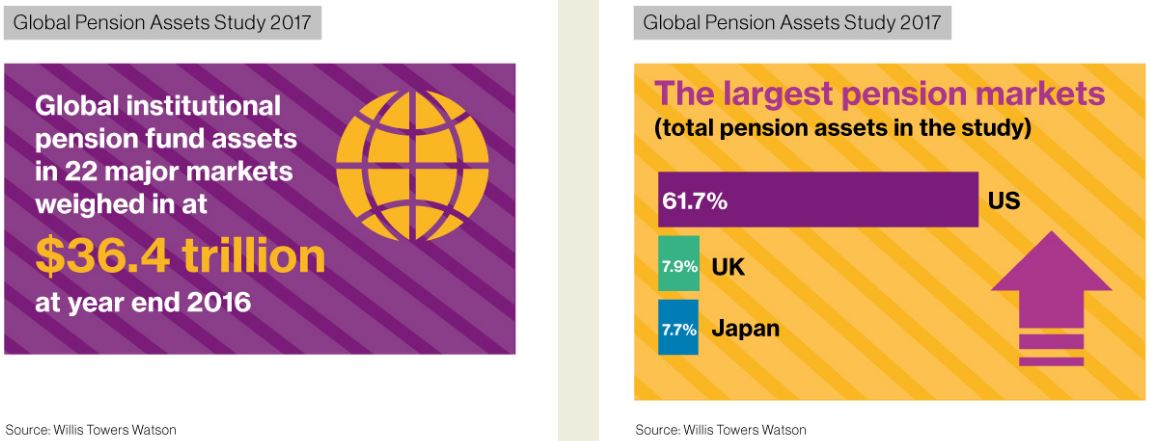
The 2017 Global Pension Assets Study covers 22 major pension markets (the P22), which total USD 36,435 billion in pension assets and account for 62.0% of the GDP of these economies. China, Finland and Italy were added to this year’s study. A deeper analysis was performed for seven of these markets (Australia, Canada, Japan, Netherlands, Switzerland, UK and US)...
This post is also available in:  Français
 Key results include:
- Global institutional pension fund assets in 22 major markets grew to $36.4 trillion at year end 2016, representing an increase of 4.3% in the 12-month period. Total pension assets in these countries amount to 62% of their GDP.
- Pension fund assets have grown at 3.8% on average per annum (in USD) over the past five years, with the growth rate highest in China (20.3%), where the study covers the Enterprise Annuities market, and lowest in Japan (-5.4%).
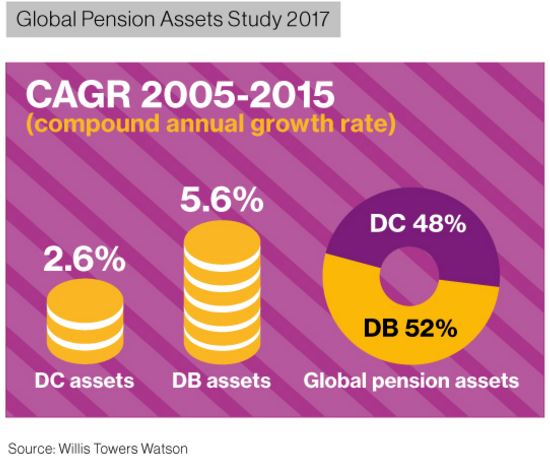
- Growth in defined contribution (DC) assets continued to outstrip that of defined benefit (DB) assets, with DC assets now accounting for over 48% of global pensions assets, compared with around 41% in 2006. DC assets have grown at a rate of 5.6% over the past decade, compared with 2.6% for DB assets.
 The analysis is organised in three sections:
- Asset size, including growth statistics and comparison of asset size with GDP (P22)
- Asset allocation (P7)
- DB and DC share of pension assets (P7).

Add Comment