


This post is also available in:  Français
Ask any active fund manager about his benchmark, and he
will have a ready-made answer. US equity managers will find
it convenient to benchmark themselves against the S&P 500.
European equity managers will likely invoke the Eurostoxx 50
as their main market gauge. Even fixed-income managers
have plenty of indices to choose from, regardless of their
location. The call is trickier for diversified fund managers,
or for investors such as pension funds taking strategic
exposure to financial markets as a whole, as opposed to
a single asset class. In the absence of multi-asset class
market indices, arbitrary benchmark choices have been
made. The understanding of the performance generated by
these investors is deeply affected.
A quick look at the benchmarks used by these investors
reveals a particular inclination for the 50/50 or 60/40
constant mix allocation in equity and fixed income. This is
partly the legacy of the twenty years up to the 21st century,
when markets featured a somewhat similar asset split.
The evolution of financial markets over the last ten years has
made such benchmark choices little indicative of the market
composition at any point in time. New multi-indexation
techniques taking into account yet to be launched stock
and bonds indices would allow doing it much more.
MARKET PORTFOLIO
Both fund managers and investors are at a loss when referring
to the market portfolio. Even if under the CAPM theory the
market portfolio is made up of an asset mix based on the
market capitalization of equities and bonds, diversified fund
managers are generally benchmarked against a constant
mix portfolio. As such, they express their bets with respect
to this constant mix benchmark, which turns out to be itself
and active bet with respect to the market.
It is easy to fault the absence of multi-asset class indices for
this apparent carelessness. But given the wealth of data on
equity and fixed income markets enabling the construction
of accurate multi-asset class indices, the investment
management industry now has little excuse for perpetuating
such behavior.
WILD SWINGS
A look at the stock/bond market portfolio, which accounts
for almost all of the performance of long-term investors,
shows that the market portfolio has been subject to wild
swings over the last ten years. This applies to most regional
markets and has direct implication in terms of performance
assessment.
For instance, the weight of the equity market with respect
to the entire market capitalization for sovereign bonds
and equities in the US reached 89% in September 2000,
whereas it was 55% in December 1987. There are also wide
differences between countries. During the nineties, the
equity weight increased in the US whereas it decreased for
Japan. The split is also very different in Germany and France
from the US and the UK. In March 2012, the equity weight
was 68% for US, 32% for Japan, 51% for Germany, 54%
for France and 66% for the UK. If investment grade bonds are taken into account, the breakdown is 50/50 in the US
and 35/65 in the eurozone. At the beginning of 2000s, these
figures were respectively 70/30 and 65/35.
These results show that it is impossible to characterize the
market portfolio by fixed weights, as diversified managers
and pension funds have long become used to. Doing so
implies that a manager with a supposedly neutral market
exposure by sticking to its 50/50 or 40/60 allocation is in fact
taking a bullish or bearish view on the market, depending on
the real asset split of the market. It also means that the alpha
that some diversified managers may claim to have generated
might be nothing else than pure market beta.

A BETTER UNDERSTANDING OF PERFORMANCE
Given the wealth of market data now available, more realistic
benchmark indices should be elaborated to benchmark
diversified funds and asset allocators in general. The implications
in terms of performance analysis would be considerable.
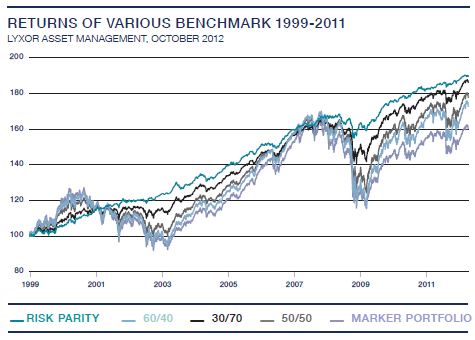
The performance analysis of a risk parity strategy allocating
amongst equity and fixed-income of developed countries
using various benchmark is a case in point. For the period
1999-2011, benchmarked against the 60/40 portfolio, the
annualized alpha and the tracking error volatility of this
risk parity strategy come at 72 bps and 7.80%, with an
information ratio at 9.2%. Benchmarked against a 30/70 portfolio, which is more representative of the traditional
portfolio of large institutional investors in the eurozone, the
same information ratio is 5.4%. By now, it should be obvious
that a 50/50 would also result in a different information ratio.
In order to avoid these arbitrary choices of benchmark, the
most rational choice is to use the market portfolio. In this
case, the information ratio is equal to 17.75%, highlighting the
value created by this risk parity strategy.
As well, multi-asset class indices would help to better assess
the performance and bets of long-term investors such as
pension funds or sovereign wealth funds. For instance, for a
pension fund, a 60/40 asset mix policy was a negative bet on
equity in 1999, but a positive bet today.
Today, it is unthinkable to manage an equity or a fixedincome
portfolio without a reference to a single asset class
benchmark. It is now time for index providers to launch similar
indexes representing the stock/bond market portfolio, even
if this enterprise that is likely to be fraught with difficulties
given the split between fixed income and equity indices
providers

Add Comment