


This post is also available in:  Français
2015: INITIALLY SUNNY, TURNED STORMY
Sailors and mountaineers know it: weather can
vary all of a sudden and change a nice family
journey into a dangerous endeavour. 2015
started like a beautiful year, blessed by as many
as fourteen central banks’ simultaneous efforts
to support the economy, with the BoJ and ECB
at the forefront. The family picture on 31 March
was great: equities and bonds were up during
the first quarter; European equities were finally
catching up with US equities (up 22%), while
Asian stocks were also posting double digit
gains, led by China and Japan.
Then, storm clouds gathered. Having bottomed out
at 7 bps on 20 April, the 10-year bund yield soared
unexpectedly to 98 bps in just a month and a half,
generating an unprecedented loss in value of 8.3%. As
soon as bond markets stabilised, the Grexit drama came
back to haunt investors and policymakers. These clouds
dissipated eventually after another marathon all-night
summit. But this was a short term relief. Concerns over
China’s foreign exchange regime and uncertainties over
the Fed’s stance caused unprecedented movements in
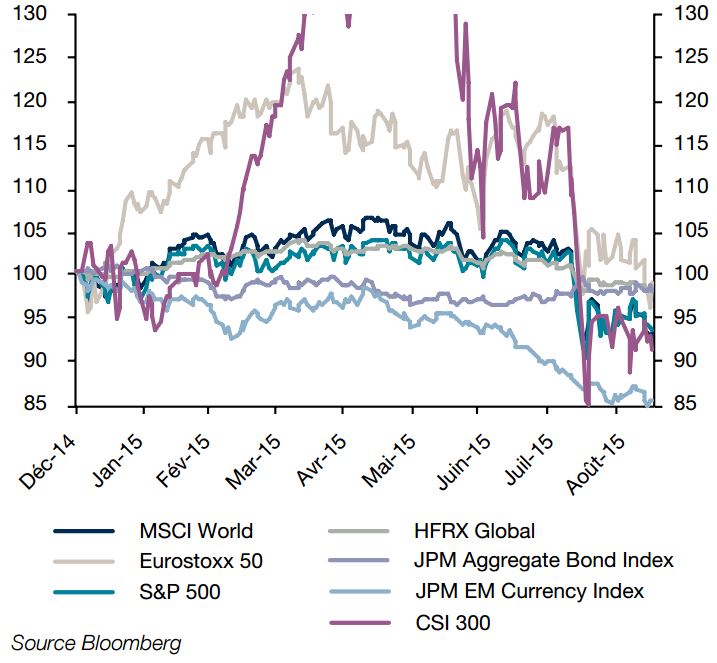
equity markets in August. Over five trading sessions,
between 17 and 24 August, the S&P 500 suffered a 10%
drawdown. Digging into the data since 1928 it appears
that the probability of such double-digit movements on
a weekly basis is below 0.5%. Over the past 50 years,
this has only happened on five occasions: October 1987,
April 2000, September 2001, October 2008 and
August 2015.
The market movement was not limited to stocks.
Commodities and emerging market currencies were
under pressure but overall, the damage was far more
pronounced on equities. The Volatility Index (VIX) jumped
from 13% on 17 August to 41% at market close on
24 August. Such a 200% rise in volatility on a weekly
basis has not been observed over the last 25 years, i.e.
as far back as our data goes (1990). During the global
financial crisis and subsequently during the eurozone
sovereign crisis, implied volatility as measured by the
VIX reached extreme levels but the jump was much

more gradual. The extent of the movement in implied
volatility registered in August 2015 was basically beyond
what we experienced in the wake of the Lehman fallout.
DESPITE MARKET WORRIES, GLOBAL GROWTH
SHOULD MAINTAIN ITSELF
There are fundamental weaknesses that justify market
jitters. The economic recovery in Europe and in Japan is
weak, large emerging markets ranging from Brazil to China
and Russia are experiencing a severe growth deceleration
and deflation risks remain significant across the board.
Meanwhile, the Federal Reserve will sooner or later have
to reverse an unprecedented accommodative stance.
The valuation of US equities signals that they are now
historically expensive, whether measured by the price-tobook
ratio or by the cyclically adjusted price-earnings ratio.
That said, it seems to us that in the medium term, the
positive developments on the US recovery front will
outweigh the negative implications of the above. Private
consumption, which has been robust lately, will continue
to receive support from lower oil prices, despite the fact
that they will depress capex from commodity sectors.
Recent data suggested that the US economy grew 3.7%
in the second quarter of 2015, fuelled in particular by
private consumption which contributed 2.1 percentage
points. Meanwhile, the US labour market is vibrant, with
unemployment in August having reached 5.1%, a level
that seems out of reach to many European countries.
Finally, the real estate market is also upbeat, with existing
home sales reaching their pre-recession pace recently
(5.6 million units in July).
Overall, the world economy is likely to be supported
by buoyant growth conditions in the United States.
However, the sharp growth deceleration in emerging
markets implies that aggregate demand will likely remain
depressed. In this environment we continue to prefer
European and Japanese equities. Their valuation remains
attractive in relative terms and earnings momentum has
recently been supportive. For the reasons listed above
we maintain a neutral stance on fixed income: a low
growth environment and deflation fears are supportive
but valuations are expensive.
STAY INVESTED INTO HEDGE FUNDS AND RISK
BUDGETING STRATEGIES
It is precisely because there are bad times that there
is a long-term premium in investing into markets. If our
scenario is correct, markets will keep on conveying the
value generated by the growth of the global economy,
possibly in a perturbed manner.
More than ever we believe that combining risk-budgeting
and alpha strategies delivers returns in the long run. Riskbudgeting
generates sound risk-adjusted returns.
Aside from this Market Premia harvesting, diversified Hedge Fund
portfolios contribute to smoothing the ride. Let us review why.
Hedge Fund strategies have proven very resilient this
year. Event Driven/ Risk arbitrage have suffered but most
Equity L/S or Global Macro managers have managed
to smoothen the global turmoil. As of end-September,
the Lyxor L/S Equity Broad index is up 1% year to date,
while global equity indices are down almost 10%. The
HFR Fund of Fund was still positive end of August
even if September moves will likely bring it in negative
territories. At that date, some Funds of Hedge Funds
were displaying positive performances, some of them
above 2%, which is quite remarkable in this environment.
Alpha strategies have been under pressure over the 6-year
market rally. But over the course of 2015, investors have
increasingly allocated to such funds due to traditional longonly
funds being less attractive in relative terms. Interestingly,
inflows into liquid alternatives in 2015 are reaching record
levels in Europe, at EUR 50bn between January-August
2015. This confirms, if any proof was needed, the long-term
hedging properties of Hedge Funds as long as investors put
enough emphasis on due diligence matters.
The short term case for risk budgeting strategies is more
involved. They have been roasted by some commentators
recently for two reasons: 1) they have contributed to
downward market movements; 2) they have posted
disappointing performances. Not only risk budgeting
has been wrongly charged of exacerbating market
movements but we point out the remarkable long-term
properties of these strategies.
Certainly risk budgeting strategies can lead the manager
to sell despite having a positive outlook on the market.
But this is like reducing the sail surface of a boat when
the wind picks up. It might prove costly if the wind falls
back but might also avoid a very difficult situation if the
wind picks up again.
As the VIX soared brutally from 13% on 17 August
to 41% on 24 August, some people judged that risk
budgeting strategies would have immediately cut their
position in the same proportion (by 3) hence worsening
the sell-off. In our view, this is very much exaggerated.
First, the worst of the sell-off happened in China
where, to the best of our knowledge, the risk-budgeting
investment style simply does not exist. Second, if most
risk-budgeting managers indeed use volatility as a proxy
for risk, they typically use a 3M to 1Y historical volatility
and not the VIX.
As an example, between 17 August and 24 August,
6-month volatility of the S&P 500 has moved from
11% to 16% which, while significant, is of a reasonable
magnitude. On top of that, the proportion of investors
investing with a risk budgeting approach is likely to be
low as compared to the value oriented approach, which
tends to increase positions when the market falls.
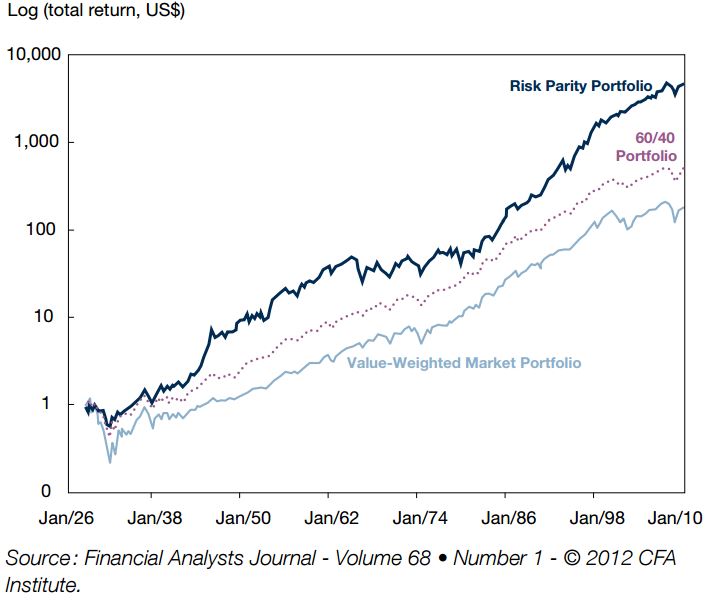
THE RISK PARITY, MARKET, AND 60/40 PORTFOLIOS:
CUMULATIVE RETURNS, 1926-2010[[Notes: This figure shows total cumulative returns (log scale) of portfolios
of U.S. stocks and bonds in our long sample. The value-weighted
portfolio is a market portfolio weighted by total market capitalization and
is rebalanced monthly to maintain value weights. The 60/40 portfolio
allocates 60 percent to stocks and 40 percent to bonds and is rebalanced
monthly to maintain constant weights. The risk parity portfolio targets an
equal risk allocation across the available instruments and is constructed
as follows: At the end of each calendar month, we set the portfolio weight
in each asset class equal to the inverse of its volatility, estimated by using
three-year monthly excess returns up to month t – 1, and these weights
are multiplied by a constant to match the ex post realized volatility of the
value-weighted benchmark.]] 
As far as their performance are concerned, riskbudgeting
strategies cannot escape the global market
sell-off, particularly when they are long-only. This said,
most of them deliver returns above traditional balanced
funds since they have reduced gradually their exposure
as long as market risk was increasing.
On top of that, the remarkable long-term properties of
risk budgeting should be kept in mind. AQR Asness,
Frazzini and Pedersen (2012) published a very long-term
simulation of a typical risk parity strategy in a article in the
Financial Analyst Journal[[Asness C., A. Frazzini and L.H. Pedersen (2012), “Leverage Aversion and
Risk Parity”, Financial Analysts Journal Vol. 68 (1).]].
Interestingly, these simulations show that not only risk parity
strategies do extremely well since 1980 but they would
have also been quite resilient between 1930 and 1980.
Similar results can be found in many textbooks such as the
authority on the matter published by T. Roncalli in 2013[[See Roncalli T. (2013), “Introduction to Risk Parity and Budgeting”,
Chapman & Hall/ CRC Mathematics Series.]].
Even if not doing it in a systematic manner, we definitely
recommend thinking in terms of risk allocation more than
in terms of dollar allocation since this has proven to be
and will likely remain much more efficient.

Add Comment